See where other traders' positions sit
A liquidation heatmap, the order book over time, positions being opened and closed, whale entry prices and footprint clusters for 756 perpetual futures. For traders who read who moves the candles, not just the candles.
Sign in with Telegram: no password, no registration form.
- 756contracts: crypto, stocks, gold, oil
- 5 layersliquidations, order book, trades, whales, clusters
- 3 exchangesopen interest and liquidations from Binance, Bybit, OKX
- 1 slive candles, trades and OI without reloading
A candle shows the result. Liqdar shows who made it.
A plain chart won't tell you who bought the breakout — new longs or shorts covering — where the big orders sit, where other traders get liquidated and whether whales are in profit right now. Here you see it at a glance.
Liquidations
Where long and short liquidations will trigger and how much money sits there.
Order book
Large orders over time: did they hold, get pulled or get eaten.
Positions by OI
Where longs and shorts were opened and where they were closed.
Whales
Average entry of top Binance traders and their liquidation levels.
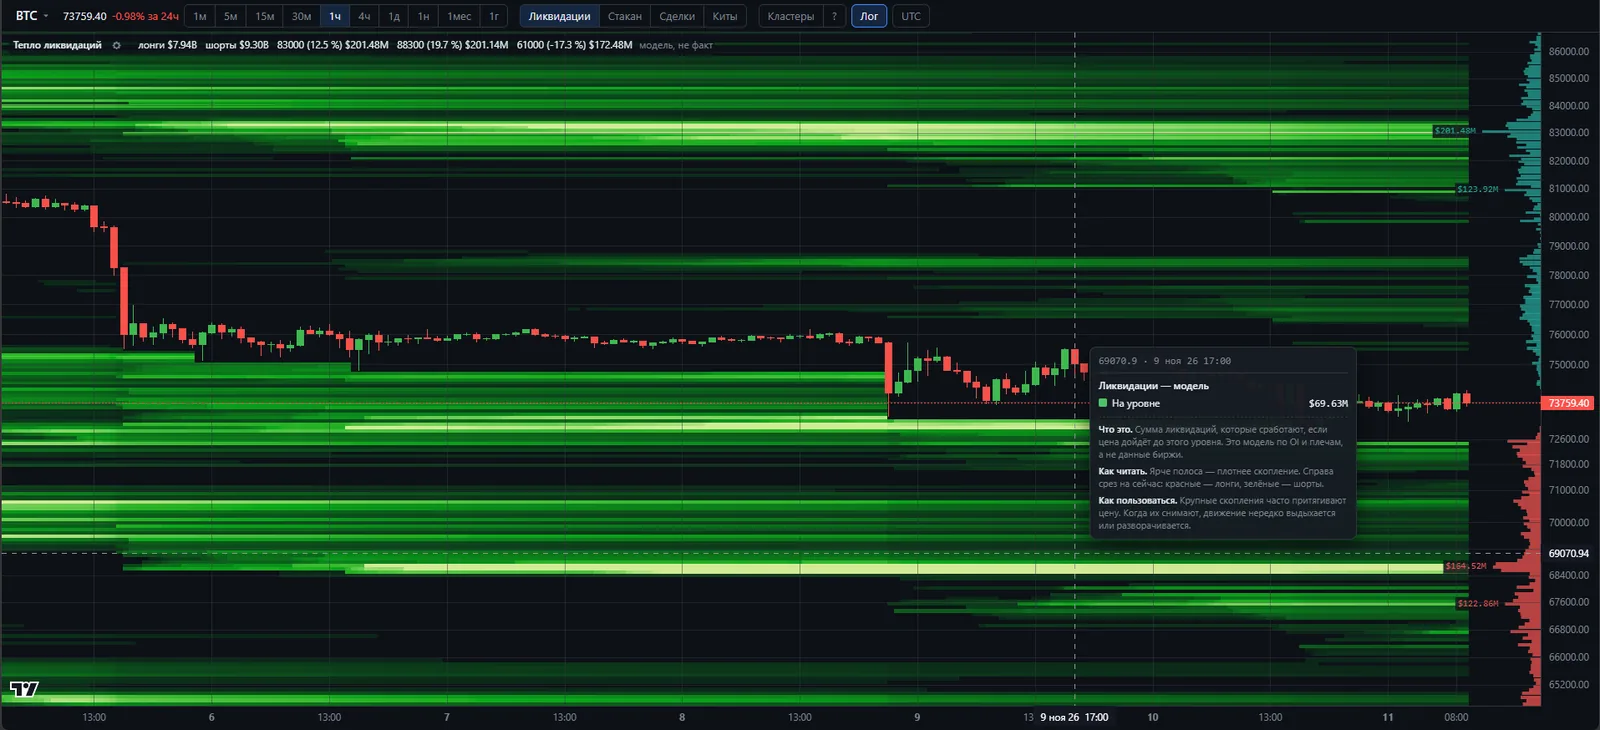
Liquidation heatmap, order book, positions, whales and clusters — five layers under the candles
A liquidation heatmap for Bitcoin, Ethereum and every altcoin: see where stops and liquidations cluster. Each layer is a time × price heatmap on any timeframe from one minute to one year. Hover a level and the tooltip shows the amounts and explains what it is, how to read it and how to use it.
Where other traders get liquidated
The amount of liquidations that trigger if the price reaches a level. It is a model built from open interest on three exchanges and typical leverage: exchanges don't publish liquidation prices. Large clusters often pull the price in, and once they are taken out the move frequently stalls or reverses.
- Brighter band — denser cluster
- Right-hand profile: long liquidations
- Right-hand profile: short liquidations
Under the price — everything that moves it
Indicators stack as panes under the candles and update live. Open interest and liquidations are aggregated across Binance, Bybit and OKX, for USDT- and USDC-margined contracts.
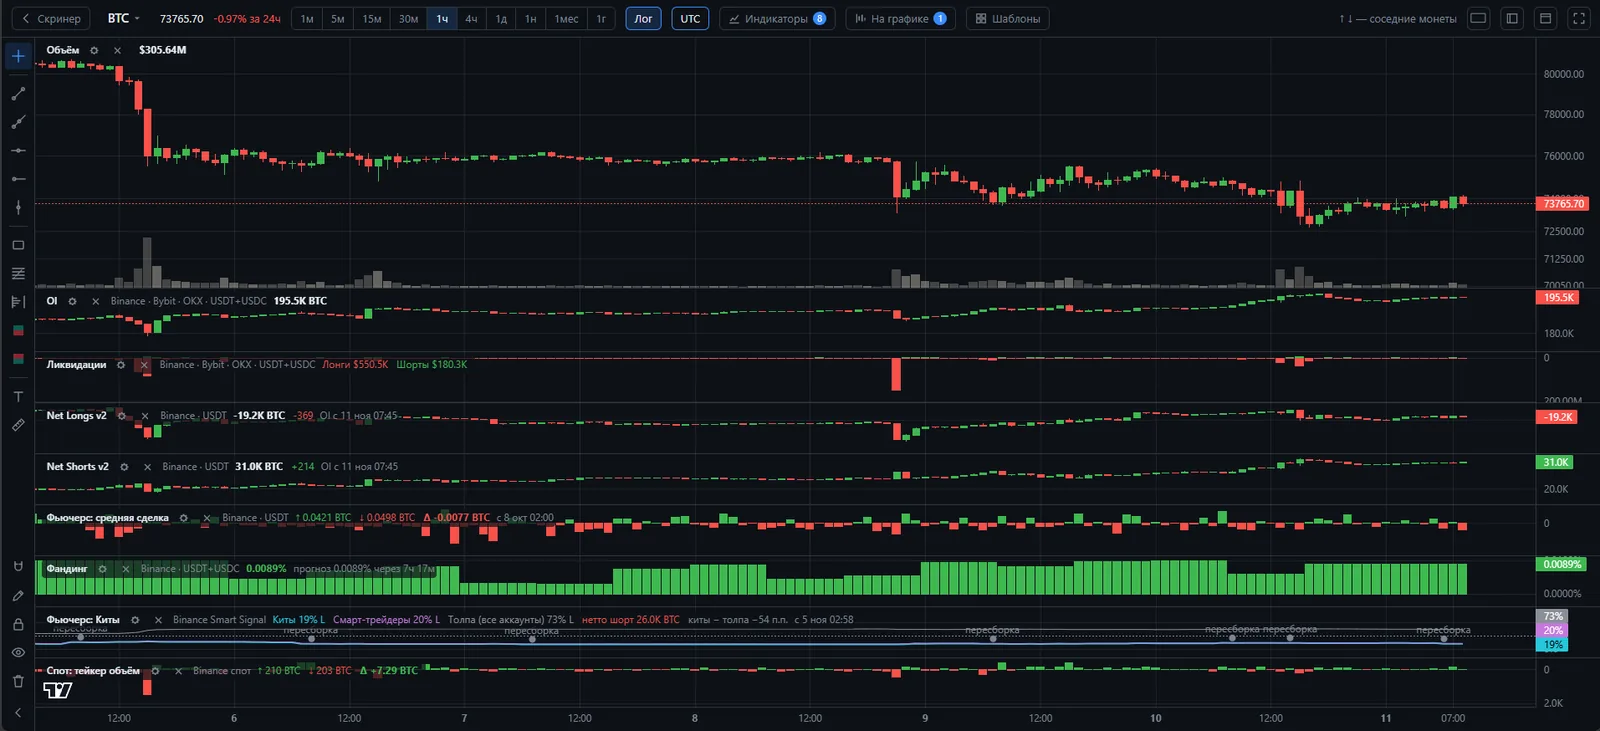
Open interest
All three exchanges combined or each one separately, with history. New money coming in or positions closing.
Liquidations
Actual long and short liquidations per candle, in dollars.
Net Longs and Net Shorts
How many longs and shorts were opened and closed: OI growth split by side.
Takers and Net Delta
Market buys versus sells, trade count and average trade size: a big player or the crowd.
Funding
Current rate, the predicted next one and time until payout.
Whales, smart traders, the crowd
Long share of each group on Binance, the whales' net position and their divergence from the crowd.
Long/Short
Account and top-trader position ratios over time.
Spot
Spot volume, taker buys, delta and the futures premium to spot: is real money behind the price.
Crypto futures screener: the whole market in one table
756 contracts, sortable by any column, with filters and favourites. Click a row to open its chart, ↑↓ arrows step through neighbouring coins.
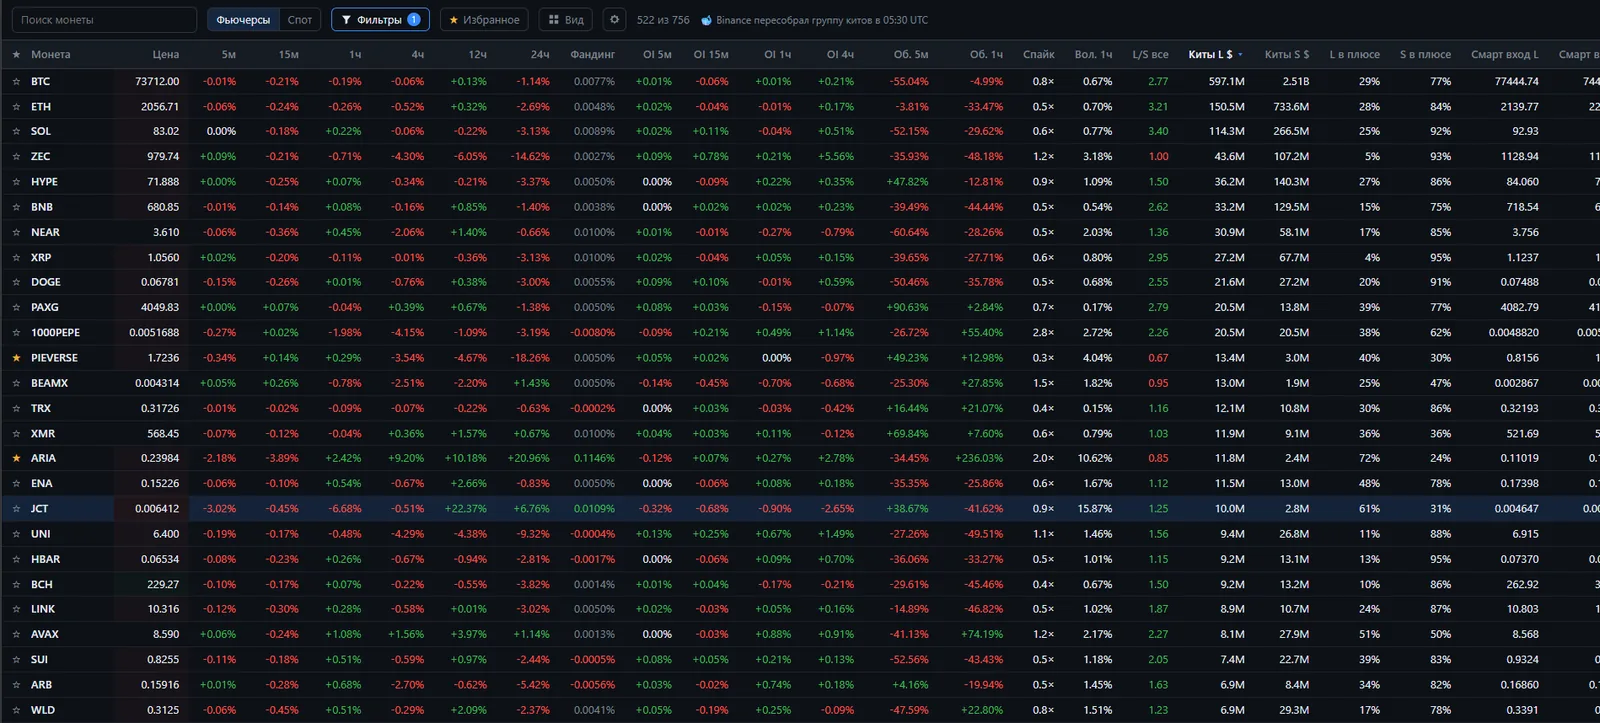
Price and volume
- Price change from 5 minutes to 24 hours
- Volume change and «spike»: coins trading many times faster than usual
- Volatility, 24h volume and trade count
Positions
- Open interest change over 5 minutes to 4 hours
- Funding and time until payout
- Crowd Long/Short
Whales and smart traders
- Number of whales long and short, their size and net position
- Average entry, price versus entry, PnL and share in profit
- Whales versus the crowd: divergence and ranking
Spot and market
- Spot volume, taker buys, spot share, premium to spot
- Market cap and rank
- Whether the coin trades on Korea's Upbit and Bithumb
And more
Help on every layer
«What it is», «How to read», «How to use» right in the chart tooltip, plus a «?» guide to all heatmaps.
Crypto and TradFi
Besides coins — futures on stocks, gold, silver and oil.
Multiple charts
Multi-chart layouts, indicator templates and drawing tools.
Log scale and UTC
Timeframes from 1 minute to 1 year, time in UTC or your own time zone.
Volume profile
Where the most money changed hands over the selected period.
Windows app
The same in its own window: lives in the tray and doesn't close with the browser.
FAQ
What is a liquidation heatmap?
A heatmap of price levels where long and short liquidations would trigger. Bright bands show where other traders' stops and liquidations cluster on Bitcoin, Ethereum or any of the 756 coins. The price often reaches for these levels, so they work as targets and as places where a move can reverse.
Are these trading signals?
No. It is a tool that shows what is happening in the order book, trades and positions. The trading decision is yours.
Where does the data come from?
Straight from Binance, Bybit and OKX: trades, order book, open interest, liquidations, funding. Whale and smart-trader positions come from Binance public data. Our server collects everything around the clock; the site and the app receive it ready to use.
How accurate is the liquidation heatmap?
It is a model: exchanges don't publish liquidation prices. It estimates levels from open interest, delta and typical leverage. A guide, not an exact figure — the chart itself labels it «model, not fact».
Who are the «whales»?
Binance accounts with more than $100k profit over 30 days. You see their number, position size, average entry and share in profit. Opening and closing is estimated from snapshots, so that is an estimate too.
Is the app in English?
The app interface is currently in Russian. Charts, tickers and numbers read the same in any language, and every layer has a built-in help tooltip.
How do I get access?
Click «Sign in with Telegram», pass a short Cloudflare check and confirm the sign-in in Telegram. The screener opens right away.
Why sign in with Telegram?
No password to invent or keep: Telegram confirms it's you. We store only your Telegram id, name and username. Telegram does not share your phone number.
Open the heatmap on your coin
Sign in with Telegram in a couple of seconds, no password, no registration.
Sign in with Telegram