
How to add an indicator
Liqdar’s indicators show money rather than price: who opens positions, who closes them, who gets liquidated and how much leverage costs. Almost all of them are drawn in their own panes under the candles; a few are drawn right on the candles.
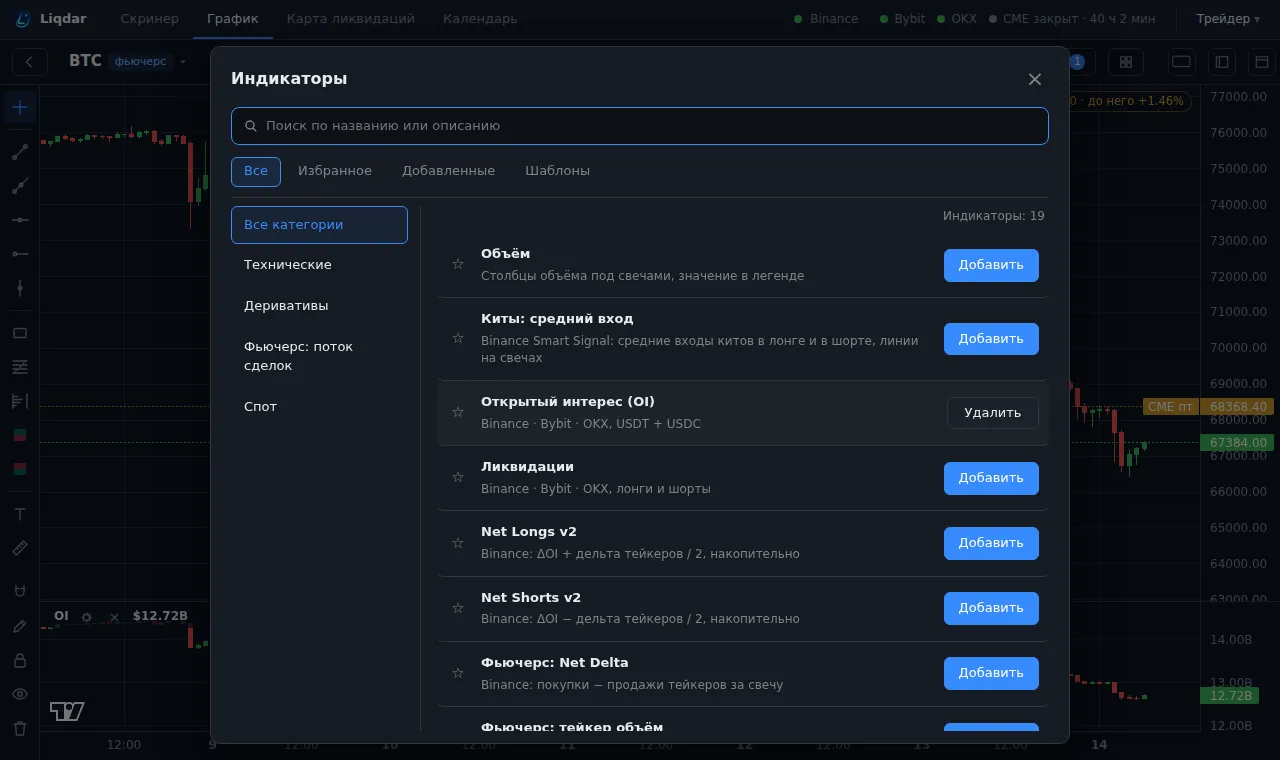
Where to turn them on
Section titled “Where to turn them on”The Indicators («Индикаторы») button above the chart. Its number shows how many indicators are already on.
In the window:
- Categories on the left: Technical («Технические», drawn on the candles), Derivatives («Деривативы»), Futures: trade flow («Фьючерс: поток сделок»), Spot («Спот»), Commodities («Сырьё»), Other («Другое»).
- Search by name.
- ☆ next to a name adds it to favourites; the Favourites («Избранное») tab shows only marked ones.
- Added («Добавленные»): what is already on.
- Templates («Шаблоны»): ready-made and your own sets, see Templates.
Clicking a name turns the indicator on, clicking again turns it off.
The indicator pane
Section titled “The indicator pane”Each pane has a legend in its top left corner: the name, the value at the candle under the cursor, and buttons.
| Button | What it does |
|---|---|
| ↑ / ↓ | move the pane up or down |
| ⚙ | the indicator’s settings |
| ✕ | remove the indicator |
Hover over a candle and the legends of all panes show their values on it. A double click on a pane expands it over the whole chart; another one brings the panes back.
Settings
Section titled “Settings”⚙ opens the settings of this indicator: exchanges, units, view, style. The bottom of the window always explains where the data comes from and how it is calculated. Settings apply at once, there is no “Apply” button.
If an indicator is empty
Section titled “If an indicator is empty”- «нет данных» (no data): the coin has no such data, for example no spot pair or fewer than 10 whales.
- «Только для 1м…1д» (1m…1d only): the indicator is calculated from clusters and works only on these intervals.
- A muted colour on the left: data from before our collection started, from another, coarser source (as with liquidations).