
Heatmaps: how to use them
Liquidation map («Карта ликвидаций») is a separate chart with its own coin and interval, with heatmaps laid over it. One map at a time is on:
| Map | What it shows |
|---|---|
| Liquidations | a model: where long and short liquidations may sit |
| Order book | limit orders by price over time, top 30 coins |
| Trades | executed market trades by price: delta, volume or positions by OI |
| Whales | whales’ average entries, their liquidations and where they built positions |
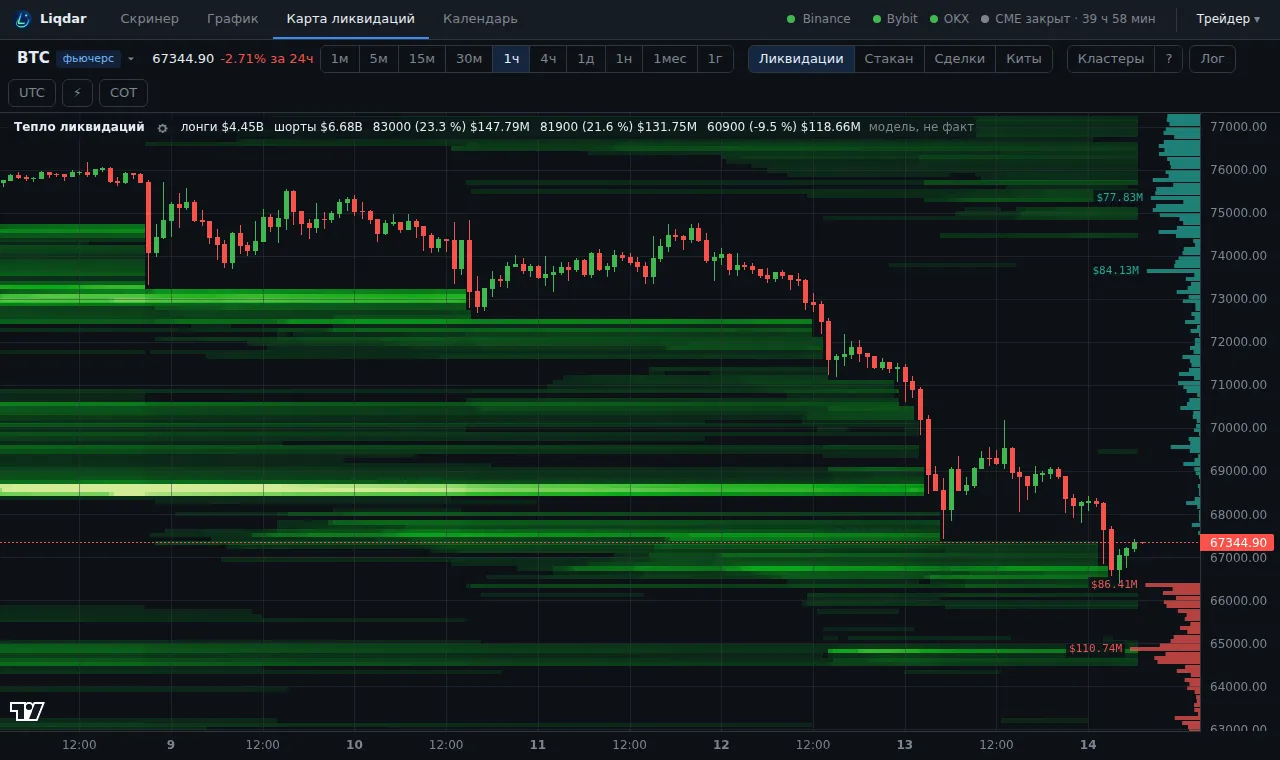
How to use them
Section titled “How to use them”- Switch maps with the buttons above the chart. Clusters can be laid over any map.
- Hover the cursor over the chart: a card shows the numbers at that level and a short “What it is / How to read / How to use”. The explanations in the card can be turned off.
- ⚙ next to the layer’s name: the map’s settings, contrast and modes.
- On the right at the scale: the snapshot “for now”, what sits at each price this minute.
- «Как читать карту» (How to read the map): the legend of the current map’s colours and marks.
Contrast
Section titled “Contrast”Soft, Medium, Sharp («Мягкий, Средний, Резкий»): how strongly large clusters stand out against small ones. Sharp leaves only the largest. Default: Medium.