
Crypto liquidation heatmap (model)
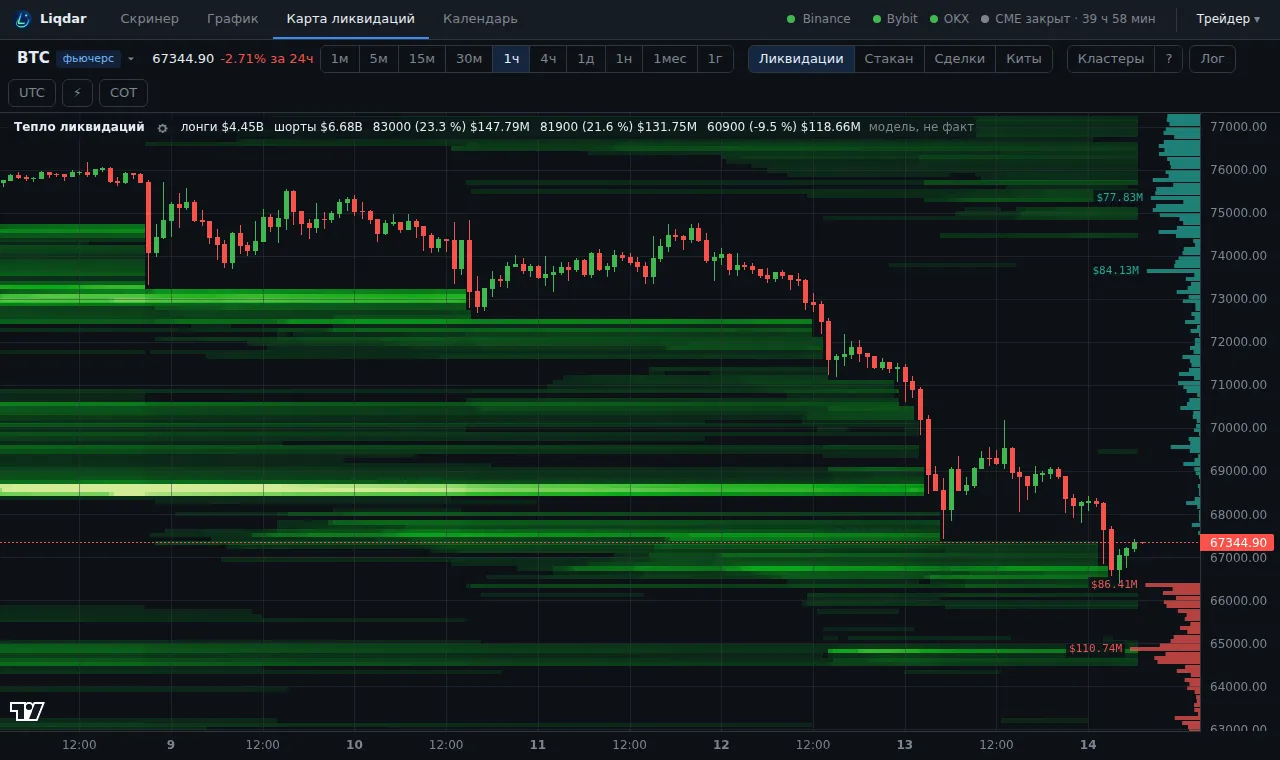
An estimate of where long and short liquidations may sit, over time: a liquidation heatmap.
How it is calculated
Section titled “How it is calculated”Exchanges do not publish liquidation prices, so this is a model. It is calculated from Binance, Bybit and OKX OI, taker delta and typical 5–50x leverage over the 30 days before each moment: where positions were opened and where such leverage would knock them out. History depth: up to 55 days.
How to read it
Section titled “How to read it”- Brightness: the sum of liquidations at the level; a brighter band means a denser cluster.
- On the right, the snapshot for now: longs red (usually below the price), shorts green (above the price).
- The cursor card: how many longs and shorts are liquidated at that level.
How to use it
Section titled “How to use it”- Large clusters attract the price: reaching the liquidations and taking the liquidity pays off for big players. They are targets.
- Once a cluster is taken (the band fades after the price passes), the move often runs out or turns.
- Compare the sides: if there are far more shorts above the price than longs below it, a squeeze up is more likely.
Actual liquidations that already happened are in the Liquidations indicator.