
Net Longs / Net Shorts: position building
Two indicators that split the OI change into longs and shorts: Net Longs v2 and Net Shorts v2. They show who is building positions and who is closing, cumulatively from the chart’s first candle.
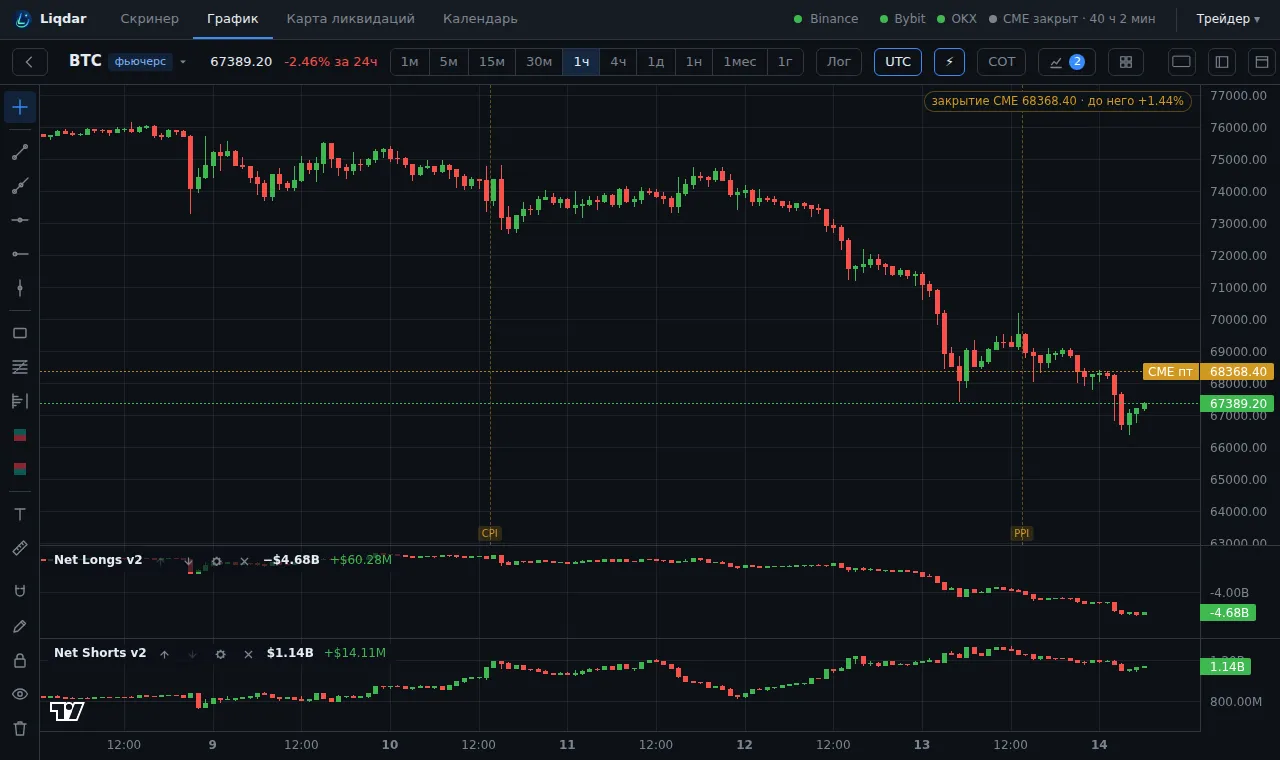
How it is calculated
Section titled “How it is calculated”For each candle:
- TD: taker delta, market buys minus market sells;
- D: the change in open interest.
Net Longs = Σ(D + TD/2), Net Shorts = Σ(D − TD/2), summed from the chart’s first candle. Binance, USDT contract. Candles are built from finer bars (15-minute ones for 1h), the current candle from real-time OI.
How to read it
Section titled “How to read it”- Net Longs rising: longs are being built. Falling: longs are closing (or being liquidated).
- Net Shorts rising: shorts are being built. Falling: shorts are closing.
- Price rises while Net Shorts rise: shorting into the move, fuel for a short squeeze.
- Price rises on falling Net Shorts with flat Net Longs: a rally on short covering, without new buyers.
It is an estimate: the exchange does not say who opened a position. Look at the direction and slope, not the absolute numbers.
Settings
Section titled “Settings”Units («Единицы»)
Section titled “Units («Единицы»)”USD or coins. Default: USD.
Style («Стиль»)
Section titled “Style («Стиль»)”Candles or line. Default: Candles.
Limits
Section titled “Limits”OI comes from our collection (kept forever) and, before it started, from Binance history (30 days). The line does not go further back.