
Footprint chart (clusters)
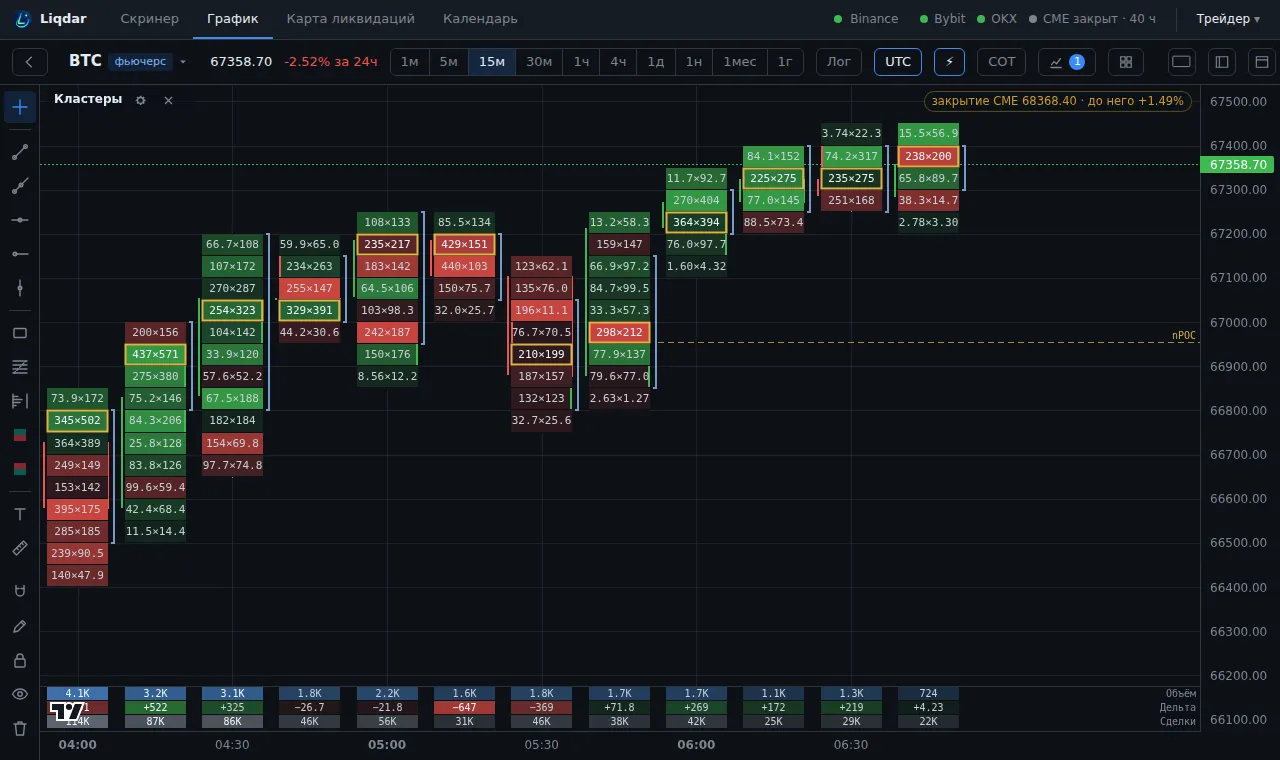
A cluster is a candle sliced by price levels. Each level shows how much was sold at market (bid) and how much was bought at market (ask). It is the most detailed view of trade flow: you see not only where the price went but who pushed it and where.
What a footprint chart is
Section titled “What a footprint chart is”A footprint chart splits each candle into price levels and labels each level with its traded volume. A normal candle shows only the open, high, low and close. A footprint shows at which prices the volume went through and who was the aggressor, buyer or seller. Russian-speaking traders usually call it clusters («кластеры»); in Liqdar they are the same thing.
How to turn them on
Section titled “How to turn them on”Indicators → Technical → Кластеры (футпринт) (Clusters, footprint), or the Clusters («Кластеры») template. Then zoom in on the chart: while the candles are narrow, clusters do not fit. Numbers in the cells appear once the column is wide enough.
A cell is green if there were more buys and red if more sells; brighter means a bigger edge. The text is “sells×buys”, for example 120×340. What for: who pushed at each level.
Гист (Hist)
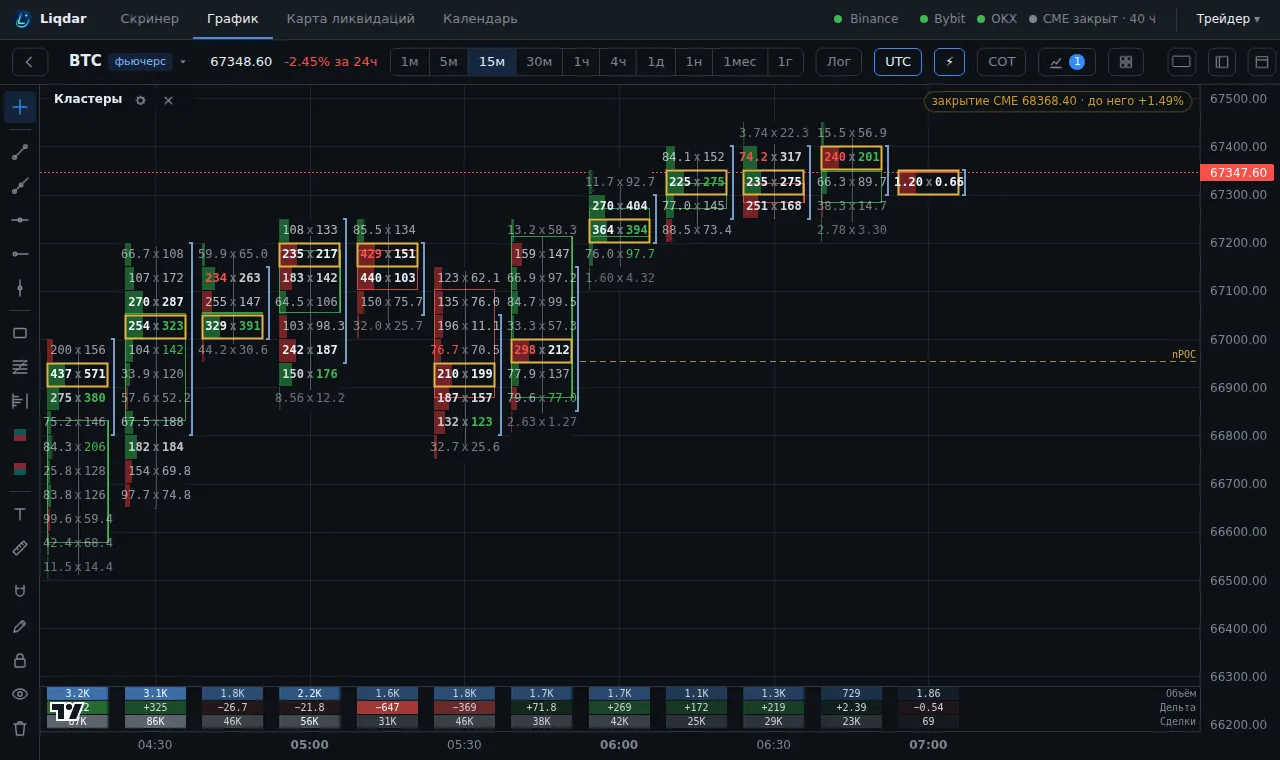
Section titled “Гист (Hist)”A bar from the left edge is the level’s volume, the colour is who dominated; the candle is drawn as an outline, the text is “bid x ask”, bolder at large levels. What for: you see at once where most volume went through.
A blue cell, brighter means more volume; the text is the level’s volume. What for: where most trading happened, without splitting into sides.
Green or red by sign, brighter means a bigger difference; the text is the level’s delta (+220, −80). What for: where the strongest skew was.
Brightness is compared within one candle. Volumes are in coins. Default: B×A.
Marks on the cluster
Section titled “Marks on the cluster”| Mark | Meaning |
|---|---|
| Yellow frame | POC: the level with the most volume in the candle, the candle’s “fair” price |
| Light blue bracket on the right | the value area VAL…VAH, where 70 % of the candle’s volume went through |
| Green strip on the right of a cell | buy imbalance: buys at the level are 3+ times the sells one level below |
| Red strip on the left of a cell | sell imbalance: sells are 3+ times the buys one level above |
| Line next to the column | a stack: 3 or more imbalances in a row, strong one-sided pressure |
| Narrow strip left of the column | the candle body (open → close), the candle’s direction |
Imbalances compare neighbouring levels diagonally: a buyer “lifts” the ask one level above where a seller hits the bid. Only levels with at least 10 % of the candle’s largest level count.
Stats at the bottom
Section titled “Stats at the bottom”Three rows under each candle:
- Volume («Объём»): buys + sells, in coins;
- Delta («Дельта»): buys − sells; green means buyers were stronger;
- Trades («Сделки»): the number of Binance trades.
Brightness is relative to the visible candles. Abbreviations: K for thousands, M for millions.
Levels
Section titled “Levels”Zones to the right of a candle that the price has not come back to yet:
- nPOC: a “naked” POC of a past candle with at least normal volume. Price often comes to close it.
- Buy imb. / Sell imb. («Имб. покупок / Имб. продаж»): zones of imbalance stacks, support and resistance.
- Sell absorption («Погл. продаж», dashed): at least 20 % of the candle’s volume went through its lower 20 % with clear market selling, and the candle closed in its upper half: limit buyers ate it all, support. Buy absorption («Погл. покупок»): the same at the top edge, resistance.
Reading it in practice
Section titled “Reading it in practice”- A rally on green imbalances and stacks: the move is real, the buyer is aggressive.
- A rally with large sells at the top of the candle and a close at the bottom: the buying was absorbed, the rally is running out.
- POC at the candle’s high or low: that is where the main fight was; price often comes back there.
- A green candle with negative delta: a divergence, a rally without market buyers.
Settings
Section titled “Settings”View («Вид»)
Section titled “View («Вид»)”B×A, Гист (Hist), Vol, Δ. Default: B×A.
Stats at the bottom («Статистика внизу»)
Section titled “Stats at the bottom («Статистика внизу»)”Turns on the Volume / Delta / Trades rows. Default: on.
Levels («Уровни»)
Section titled “Levels («Уровни»)”nPOC, imbalance and absorption zones. Default: on.
Intervals and history
Section titled “Intervals and history”Intervals 1m…1w. On 1m…1d: the last 30 days; on 1w: the whole history on the server (BTC since 1 June 2026), and levels on 1w also cover the whole history. Clusters are built from all trades of Binance USDT contracts; past days are loaded from the Binance archive.