
Whale map
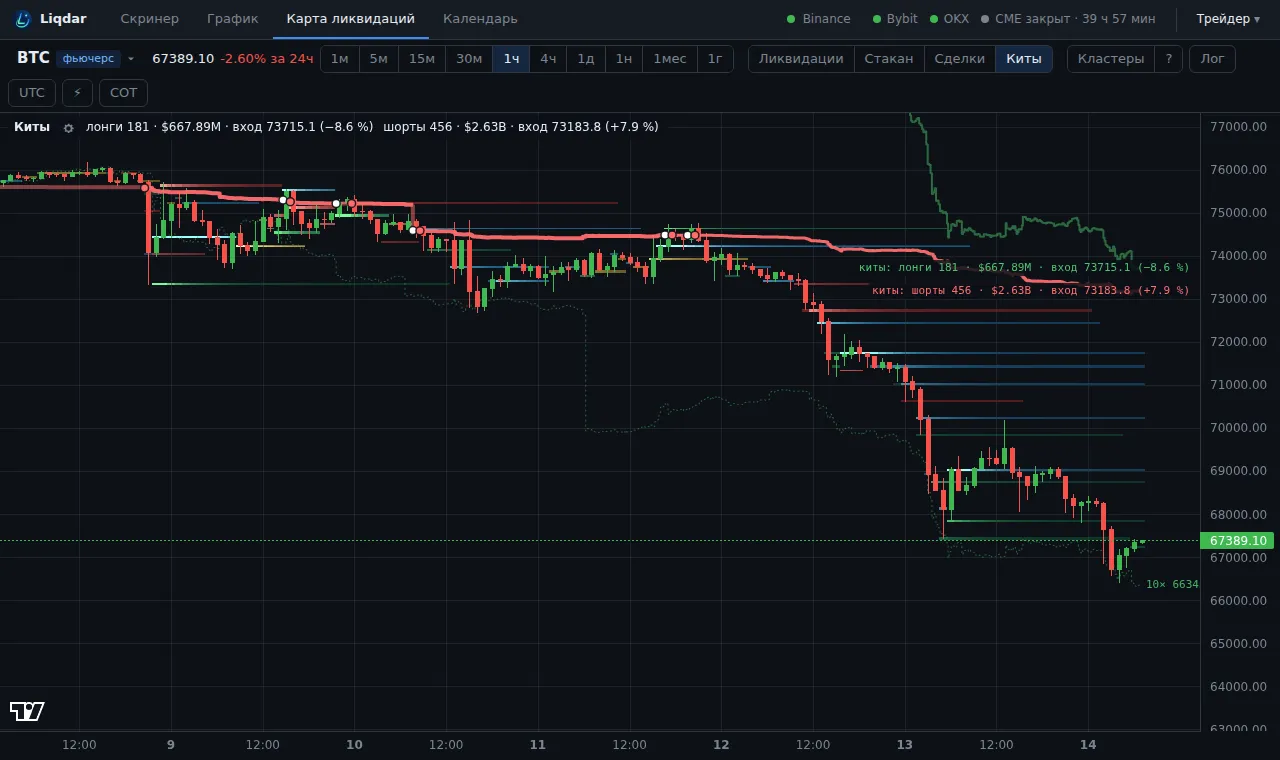
Whales are Binance accounts with over $100k futures profit over 30 days (Binance Smart Signal). The map shows their average entries, where they would be liquidated, and where they built and closed positions.
Legend
Section titled “Legend”- Lines: the whales’ average long entry (green) and short entry (red); the width is the position size.
- A bright line: the side is in profit; pale: at a loss.
- A dot: the price crossed the whales’ entry.
- A thin dashed line: where whales would be liquidated at the chosen leverage.
- Heat: whales built longs, built shorts, closed shorts, closed longs.
- The cursor card: «Лонг N · $volume · вход price (result, in profit %)» (Long N, volume, entry).
Settings
Section titled “Settings”Whale liquidations («Ликвидации китов»)
Section titled “Whale liquidations («Ликвидации китов»)”None, 10× or 5×, 10×, 20×: the leverage for the liquidation lines from the average entry. Default: 10×.
Where they built («Где набирали»)
Section titled “Where they built («Где набирали»)”Show or hide the heat of building and closing positions. Default: Show.
Level memory («Память уровня»)
Section titled “Level memory («Память уровня»)”None, 4 h, 1 day, 3 days, as on the trades map. Default: 4 h.
How to use it
Section titled “How to use it”- Whales defend their break-even at their entry: the price often turns there.
- Whales are at a loss and the price moves away from their entry: near their liquidation line the move may speed up.
- The “built” and “closed” zones are the whales’ working levels.
Limits
Section titled “Limits”- With fewer than 10 whales on a coin the averages are unreliable and there are no lines.
- Building and closing are estimated from snapshots, so this is an estimate too.