
Side volume
The volume of the visible candles by price, at the right scale («Боковой объём» in the app): sells darker, buys lighter.
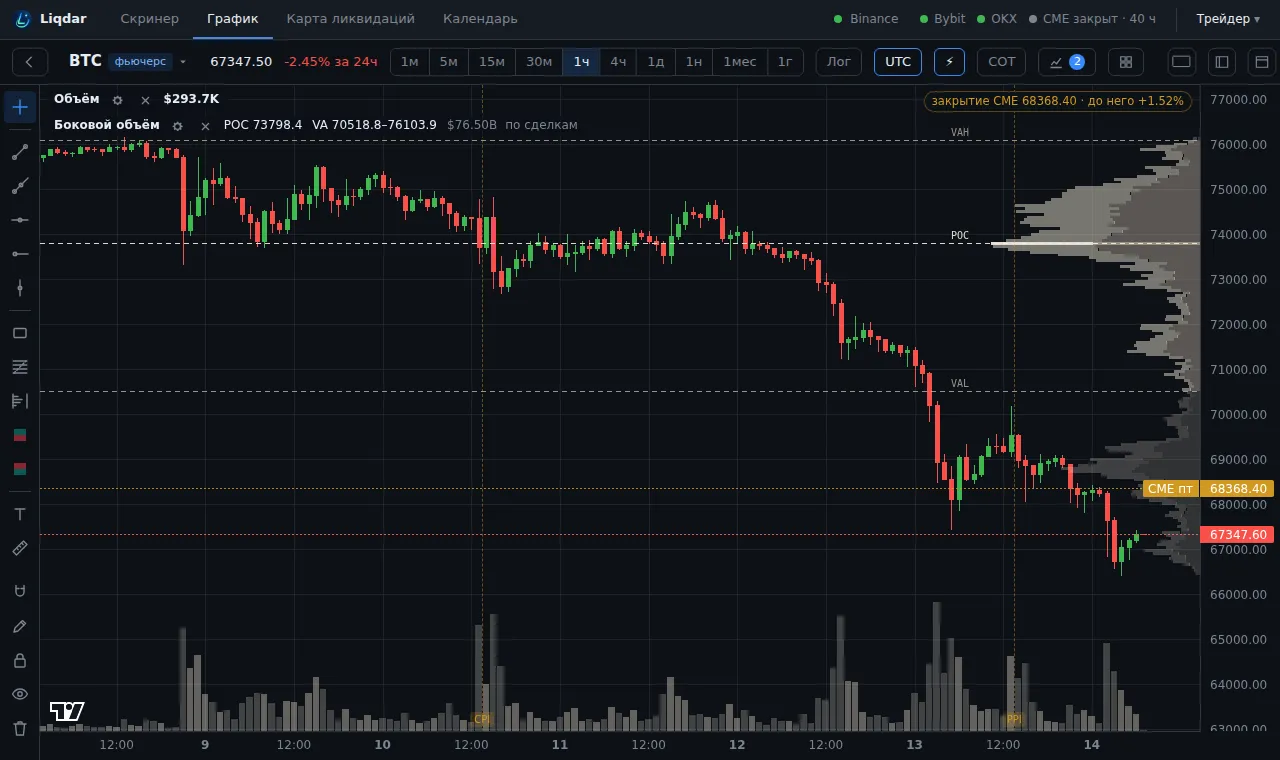
What is on the profile
Section titled “What is on the profile”- The almost white bar is the POC: the most traded price of the visible part.
- Brighter: the 70 % volume area (VAL…VAH).
- It recalculates as you scroll and zoom: show a week and you get the week’s profile.
How to read it
Section titled “How to read it”- The POC and the edges of the 70 % area work as levels: price returns to them and bounces off them.
- A gap in the profile (little volume): price passes such places quickly.
- Price left the 70 % area and held: the start of a new range.
Settings
Section titled “Settings”POC and VA lines («Линии POC и VA»)
Section titled “POC and VA lines («Линии POC и VA»)”Horizontal POC, VAH and VAL lines across the whole chart. Default: on.
Precision
Section titled “Precision”Where there are clusters (the last 30 days), the volume by level is exact, from trades. For other candles the volume is spread evenly over the candle’s range, which is an estimate. The legend shows the precision: «по сделкам» (from trades), «N % по сделкам» (N % from trades) or «оценка по свечам» (estimate from candles).